
Colour management standards and process controls have helped meeting client expectations in colour reproduction. How can we accurately predict, prepare and communicate expected results? David Zwang, print Land packaging consultant, New York finds out.
Labels and Packaging: Predicting and achieving consistent color across disparate press platforms and media
By: David Zwang
Abstract: Color management standards and process controls have helped raise the bar on defining and meeting client expectations in color reproduction. However, as we see more cross platform and cross media packaging and marketing campaigns, how can we accurately predict, prepare and communicate expected results?
Article
I have been very involved in color management since well before the ICC was created and the resultant standards and processes were introduced. Prior to that time, achieving good color management was like trying to accurately hit the head of a pin with a shot- gun. Tools and processes were very vendor specific and relied on highly skilled color professionals. The subsequent introduction over time of color management standards and process controls have streamlined the process. However, it has also raised the bar on client expectations and the need to meet those expectations in color reproduction. Add to that the introduction of more cross platform and cross media packaging and marketing campaigns and it becomes a difficult task. How can we accurately predict, prepare and communicate expected conformance results before the job is printed?
There are a lot of color management applications available from stand-alone color management servers like the gmg ColorServer, ColorLogic Smart Server and Esko’s Color Engine among others. There are also solutions promoted to work with print device DFEs (Digital Front End) from companies including EFI, Canon, Xerox, etc., however none of these solutions really have taken the unique approach the solution of predicting, preparing and communicating as ChromaChecker. Initially introduced in 2015, over the course of the last 3 years this ‘color conformance platform’ has evolved into what I believe is a must have for almost any print service provider, but especially for those involved in labels and packaging.
ChromaChecker is a very interesting application that takes a holistic approach to its view of color management. First of all, it can assess any digital or conventional output device. This could include proofers, toner, inkjet, offset, flexographic, gravure, etc. It assesses not only process control metrics such as whether or not the device, ink and media combination pass G7 compliance, but more importantly provides a metric that defines the relative difference of prints to ‘the client’s expectation’. It does this from the ground up, by comparing media characteristics, ink characteristics, press characteristics and viewing characteristics independently as well as in combination to help determine if and which combination is going to be possible to meet a client’s visual and measurable expectation.
At the core of the application is what they call their E Factor, which is based on the Delta e 2000 cumulative relative frequencies to the 95th percentile, which provides a metric that defines the relative difference of two measurements. To accurately assess your clients’ relative expectation, you should first psychometrically characterize their expectations as you would a device. ChromaChecker includes an application that can be used to visually compare differences and then quantify those differences into a definable E Factor metric. In essence it allows you to establish their level of tolerance in reproduction differences. The accuracy of this process was confirmed in a TAGA study in which, according to David Hunter of Pilot Marketing and ChromaChecker, partnering with Robert (Bob) Chung of RIT performed psychometric tests to figure out where the industry acceptability tolerances are. In the study, 80 people took the psychometric test comprised of eighty paired comparisons with images that had different factors. They found that there was a phenomenal mathematical correlation to the E Factor. They found that 95 percent of the respondents when shown an E Factor difference of two or less said it was a good or excellent match, and they rated unacceptable when showing an E Factor eight or more.
E Factor

Using the E Factor, as a label or packaging services provider this can enable you and your brand customer to measure and visually see how well the brand colors can be represented on different press technologies and different medias. This is possible through a simulation of accumulated testing data. This is equally the case for process and special (spot) colors.
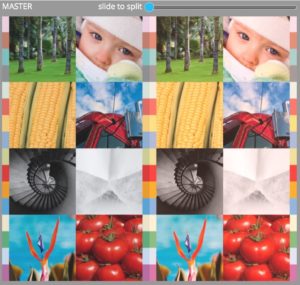
Many print service providers and equipment manufacturers use ChromaChecker to test and compare their base systems as well as a variety of system and component combinations for gamut size, variation within a page and page to page, accuracy, repeatability, and long-term reproducibility of a single target. It has as dashboard that provides an easy way to view the results. (Figure L1)
In the dashboard screen capture above you can see the quick performance review, with the ability to navigate down to the details.

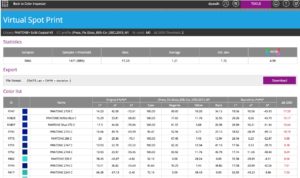
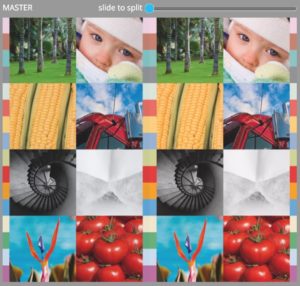
Press, Paper and Print service providers use it to test and simulate spot color reproduction as seen aside. (Figure L2)
Since it is a cloud-based application it can be used to monitor, manage and compare multiple sites with disparate devices, making it valuable tool for larger multi plant organizations.
There is also a resolution evaluation feature that provides a comparison of the resolution of different devices through measurement and visual testing. This can also be used as a way to determine acceptable resolution at different viewing distances for sign and display printing.
While there are many different color management tools out there, ChromaChecker is agnostic, by far the most comprehensive, works with just about any spectrophotometer. In conclusion, the real value is that you can compare, simulate and then tailor a variety of component variables prior to going to press, to help address the cost and time pressures felt by brands and print and packaging service providers.
David Zwang travels around the globe helping companies increase their productivity, margins and market reach. He specializes in production optimization, strategic business planning, market analysis, and related services to companies in the vertical media communications market. Clients have included printers, converters, manufacturers, retailers, publishers, premedia and Government agencies. He can be reached at david@zwang.com.
This originally appeared on WhatTheyThink.com. Copyright © 2019 WhatTheyThink. All rights reserved. Reprinted with permission. WhatTheyThink is the global printing industry’s leading source for unbiased market intelligence. Stay on top of emerging trends with the printing industry’s premier daily newsletter. whattheythink.com/join/